Published 20 October 2019
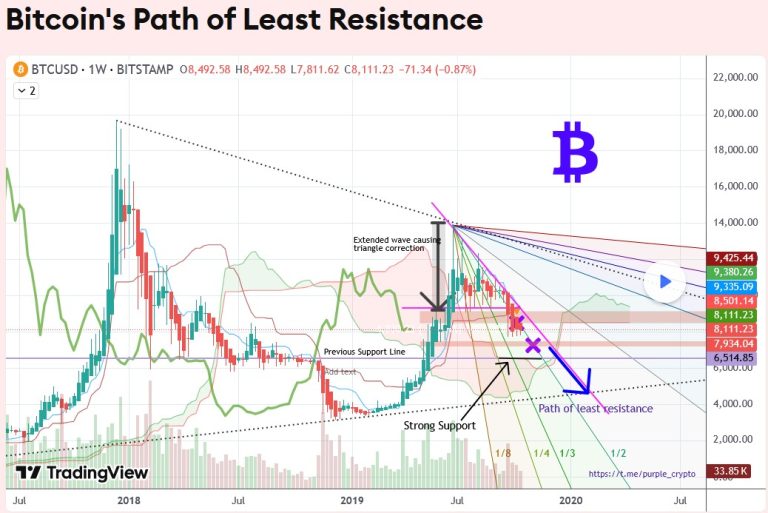
Chart published on Trading View.
When it comes to the forces of nature, the preference is always for the path of least resistance. This is the way in which water flows.
Albeit its attempt to break through the 1-1 Gann trajectory (and failing miserably) in my analysis of Papa Bear’s Preferred Trajectory (below) which it has been tracing neatly, one can safely assume that it will have a preference for the same path, aligning with the 1-1 Gann trajectory and very likely keeping on the inner-side of the pink trend line.
What further consolidates this grand plan, especially if we expect Big Brother to continue its downwards correction even if it does rise up briefly, is the path of least resistance offered by the thin Kumo cloud. While it may well attempt to break into the cloud sooner rather than later, I can’t imagine it proceeding too far. A previously marked strong support line sits right on the mark with the top of the cloud (the Senkou Span B – black line). This together with the thick Kumo cloud offers an extremely strong zone of support for the next 2 weeks.
Looking back at Papa Bear’s history, it took a similar path of least resistance in 2018 where it broke through the Kumo cloud at the thinnest section in its correction phase.
I don’t believe Papa Bear will let go of its dominance so easily. After all, it is Queen in the world of crypto. What this path does offer is a little breathing space and the opportunity to gradually accept its momentary fall from grace while we capitalise on the growth of other rising cryptos.
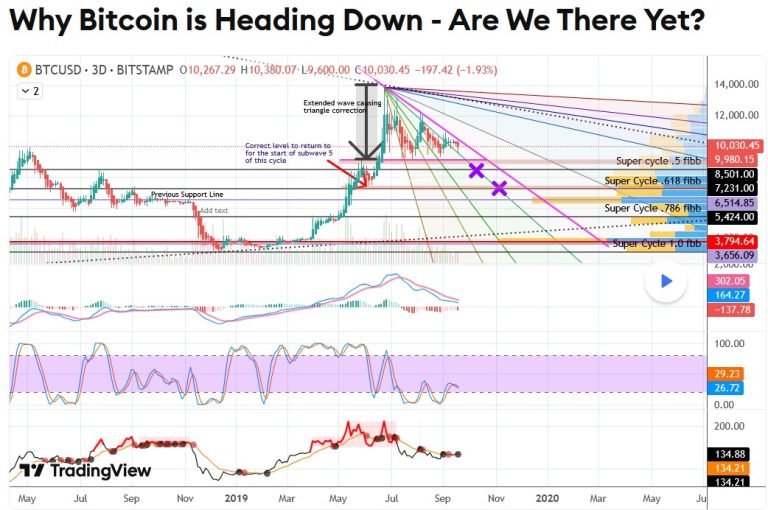
Update 29 October 2019
Bitcoin has clearly hit the level of the ‘x’ marked on the chart at the level of the lower red zone exactly on point, albeit a little earlier than scheduled.
It is currently travelling between the 2 marked red zones, has yet to successfully break out of the pink upper trend line and still has the strong support of the Senkou Span B in play.
My analysis remains in status quo until and unless it proves otherwise.
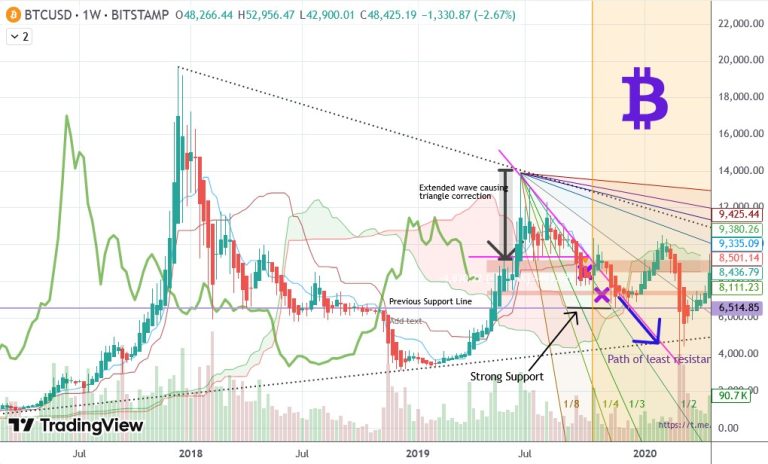
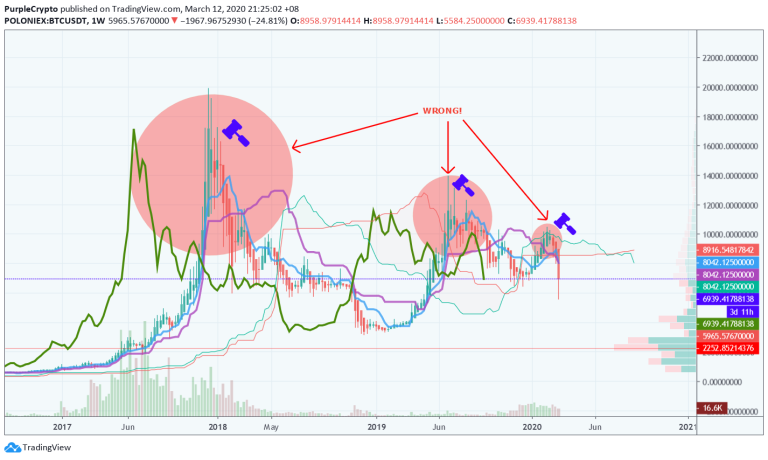
Update 13 March 2020
It should never have happened.
The target(s) and/or pattern(s) on this chart is only theory and not a trade signal of any kind. Always do your own research before trading.
Past performance isn’t an indicator of future performance.