Published 22 April 2020
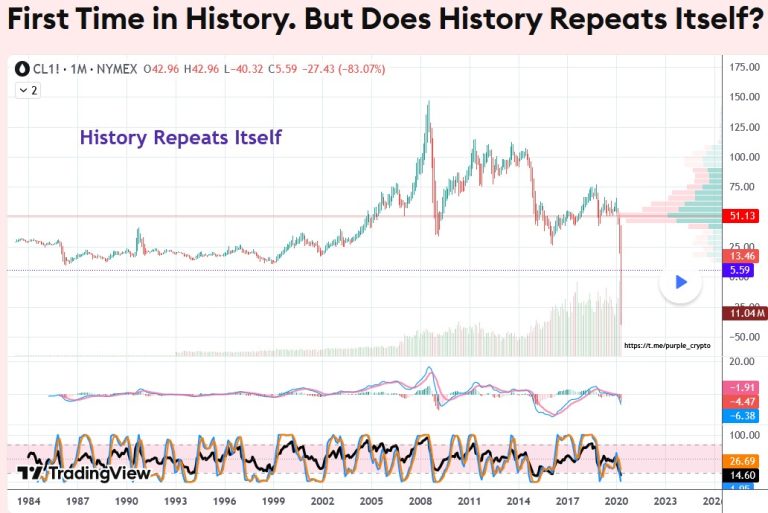
Chart published on Trading View.
Back in January, an anomaly occurred on a website that calculates Bitcoin transaction fees and displays them on a long-term chart. An anomaly where Bitcoin transaction fees went into negative territory for the first time ever in history.
At that time, I posted a Tweet (here – twitter.com/Purple___Crypto/status/1212634673697808384) exclaiming how bizarre it was that that happened, while many retorted that it was an error in the website’s algorithm. But was it?
Whether it was an error or a sign of what was to come, no one will ever know. But nothing stops us from making an educated guess…a very educated guess. 🙂
I can’t go past the uncanny resemblance between that chart and this one (comparison in this tweet – twitter.com/Purple___Crypto/status/1252518667562221568) where crude oil prices dove into negative territory for the first time ever in history.
There is a first time for everything. There’s also the saying “history repeats itself”.
Leaving on another note, I proudly share with thee the launch of my brand new website and the link to it – https://www.purplecrypto.online – Now anyone can join us on our journey to consistent winnings.
The target(s) and/or pattern(s) on this chart is only theory and not a trade signal of any kind. Always do your own research before trading.
Past performance isn’t an indicator of future performance.