
Published November 22 2019
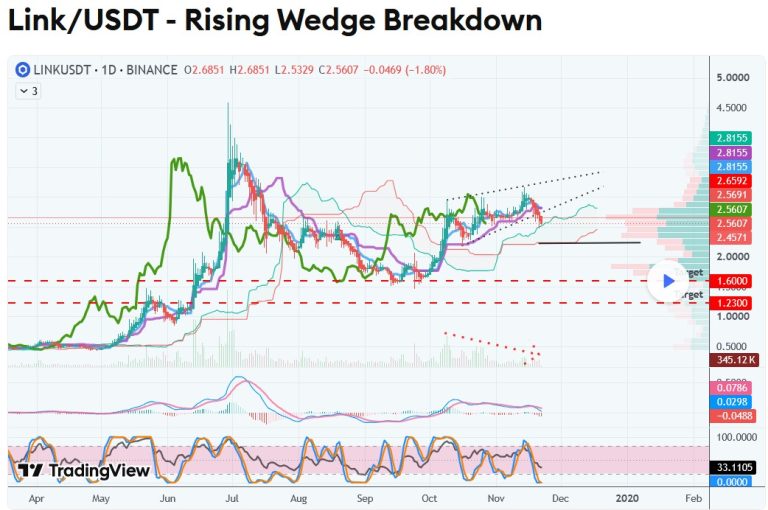
View this chart on Trading View.
Chainlink has broken down a rising wedge. The decreasing volume (on the bottom of the chart) is confirmation of the successful breakdown.
Based on wave analysis, it is possible it may downtrend further.
Shorts are not something I trade personally, so this idea is only for the benefit of my followers who do and for those considering adding to Link’s technical analysis.
=> possible completion of sub waves 1 & 2 of the 0-a wave of its downwards correction with an oncoming sub wave 3, OR
=> completed a-b (or yet to complete a-b) of the corrective sequence (less likely in my opinion, taking retracement values into consideration – but not impossible).
Currently hovering around the top of the Ichi cloud, it is not being very positive about continuing upwards. it would be interesting to watch its movements if and when it hits the strong Senkou Span B support line (marked black).
Likely targets are marked on the chart should it continue to downtrend. Always use any idea in conjunction with your own technical analysis before trading.
Updated 17 December 2019
Target hit.
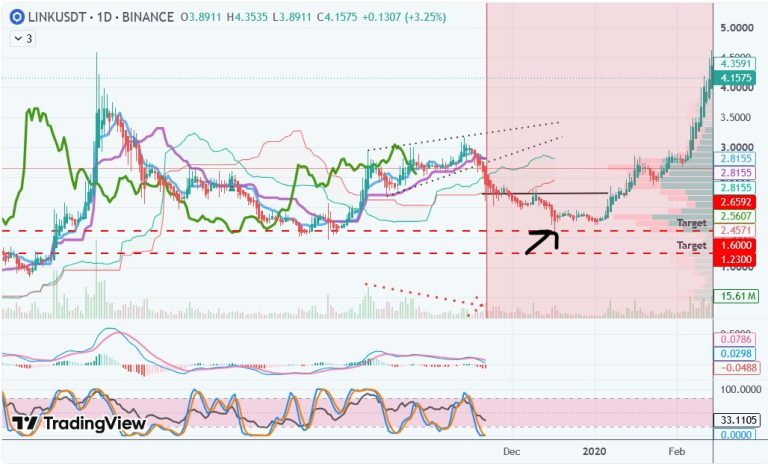
The target(s) and/or pattern(s) on this chart is only theory and not a trade signal of any kind. Always do your own research before trading.
Past performance isn’t an indicator of future performance.