
Published September 24 2026
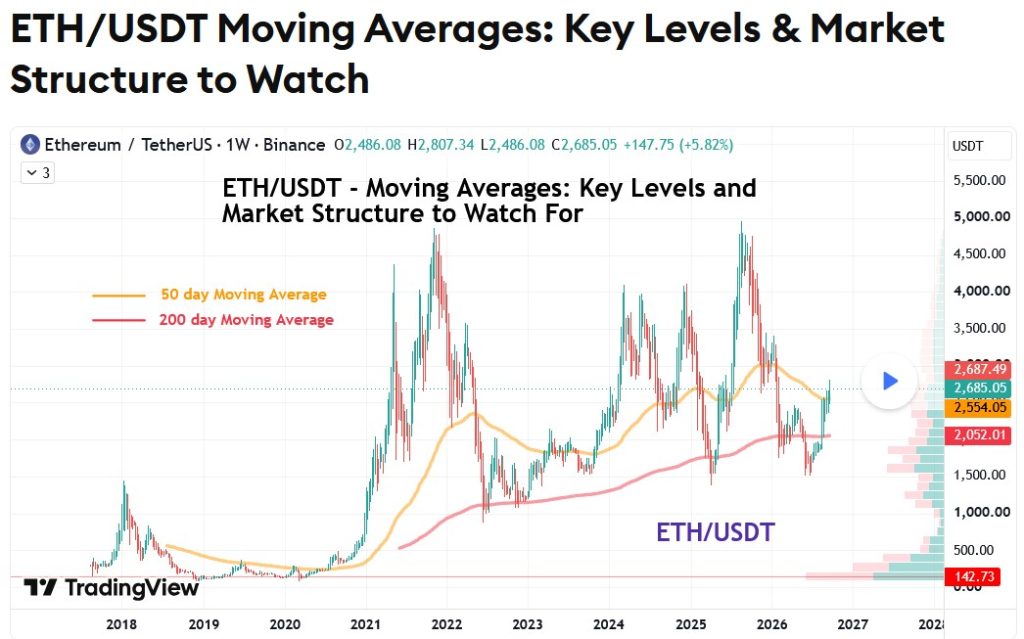
View this chart on Trading View.
Moving averages are among the most widely used indicators in cryptocurrency and digital asset trading. Traders use them to smooth price data, identify trends, assess market structure and locate areas where price may react. But one fact is essential to understand before relying on any moving average trading strategy: a moving average moves because of past price action.
A moving average does not predict where Bitcoin, Ethereum or another cryptocurrency will trade next. Instead, it processes historical prices and creates a continuously updated average. As new price data enters the calculation and older data leaves it, the indicator changes.
For traders studying market structure, this distinction is critical. A moving average can help organise information about what the market has already done but it should generally be viewed as a lagging indicator rather than a crystal ball for future prices.
A moving average calculates an average price over a specified period of time. The most common versions are the Simple Moving Average (SMA) and Exponential Moving Average (EMA).
A 20-day moving average, for example, incorporates the prices from the most recent 20 candles on the daily timeframe. When a new candle forms, the oldest observation eventually drops out of the calculation and the newest observation enters. The result is a line that moves with price while filtering out some of the short-term noise.
On this Ethereum chart for example, we have the 50-day moving average line in orange and the 200-day line in red. The 50-day moving average shows historical price action over the past 50 days and the same applies to the 200-day moving average line which shows the past 200-day price action.
The EMA gives greater weight to more recent prices, which generally makes it respond more quickly to changes in market conditions. The SMA gives observations equal weighting within its calculation period. Neither approach is inherently predictive. Both are mathematical transformations of historical market data.
Understanding this mechanism can prevent one of the most common mistakes in technical analysis.
Suppose a cryptocurrency has been trading at $1,500, and its 50-day moving average is around $2,500 (as is the case on this chart). If several new candles close substantially above the previous prices included in the calculation, the moving average may rise.
It rises because recent price observations have changed the average.
Likewise, if newer prices are lower than the prices being removed from the calculation, the moving average can decline. This means that the direction of a moving average is itself information about historical price behaviour. An upward-sloping moving average indicates that the underlying prices used in its calculation have generally been increasing. A downward-sloping average indicates the opposite.
However, traders should avoid interpreting the moving average slope as a guarantee that the trend will continue.
Market structure refers to the way price forms swings, including higher highs, higher lows, lower highs and lower lows. Moving averages can provide additional context for these structures.
In a market producing higher highs and higher lows, price may remain above a rising moving average for an extended period. Traders may describe this as a bullish market environment. Conversely, a sequence of lower highs and lower lows accompanied by a declining moving average can indicate sustained downward momentum.
Moving averages can provide additional information about market structure. On this chart, for example, Ethereum has just achieved a higher high after a long-term downtrend since the top in August 2025 and interacted with the 50-day SMA. The orange line is derived from that price history. The important point is that the price structure comes first. The moving average is derived from that price history.
For example:
– Higher highs and higher lows may indicate an established upward structure.
– Lower highs and lower lows may indicate a downward structure.
– A sideways range may cause the moving average to flatten.
– Rapid changes in price can cause a moving average to change direction after the market has already begun moving.
This relationship helps explain why moving averages are particularly useful when combined with direct observation of price structure.
Different traders use different periods depending on their trading time-frame and objectives. Common examples include the 20-, 50-, 100-, and 200-day moving averages.
The 20-day moving average is often used to monitor shorter-term price behaviour. It can help traders visualise whether recent price action is generally moving upward, downward or sideways.
The 50-day moving average is frequently used as a medium-term reference point. On higher time-frames, traders may watch it for changes in the broader trend.
The 100-day moving average can provide another perspective on intermediate-to-longer-term market conditions.
The 200-day moving average is widely followed because it represents a much longer historical window. Traders frequently monitor it when analysing major cryptocurrency pairs and other financial markets.
The levels these moving averages provide should not automatically be treated as precise support or resistance. A moving average is a dynamic calculation, not a fixed horizontal price level.
One reason moving averages receive so much attention is that price can repeatedly interact with them. For example, during a sustained trend, price may pull back toward a moving average before continuing in the prevailing direction. Traders sometimes refer to this behaviour as a moving-average retest.
But the moving average itself did not cause the price reaction. Caution should be taken though before assuming that simply touching a 50-day or 200-day moving average will reverse a trend or price. On this chart, the more useful information from this sort of price movement is that Ethereum has hit a price which it had hit in the past.
Several market participants may be watching the same widely followed level, while the underlying market structure, liquidity, positioning and sentiment can influence how price behaves around it.
This distinction matters when analysing cryptocurrency markets. A trader should avoid assuming that simply touching a 50-day or 200-day moving average automatically means price will reverse. The reaction—or lack of reaction—is itself useful information.
Moving-average crossovers are another popular technical analysis technique.
A common example occurs when a shorter-term moving average crosses above or below a longer-term moving average. On this weekly Ethereum chart, we have yet to see such a cross. Traders may interpret these events as evidence that the relationship between recent and longer-term historical prices has changed. A cross down of a 50-day MA below a 200-day MA, for example, is called a “death cross” and the reverse – a cross up – is call a “golden cross”.
The crossover is inherently based on past data. By the time two moving averages cross, price has already moved sufficiently to alter the calculations. Consequently, a crossover should generally be understood as a confirmation of changing historical conditions rather than a precise signal that predicts the next market move. This is particularly important in volatile cryptocurrency markets where price can reverse quickly after a crossover.
Moving averages can become more informative when considered alongside market structure rather than used in isolation.
Consider a hypothetical cryptocurrency that has formed a sequence of higher highs and higher lows while trading above a rising 50-day moving average. A trader studying the chart might monitor whether the next pullback creates another higher low and how price behaves around the moving average. Alternatively, if price breaks below the moving average while simultaneously violating a previous swing low, the combination provides more structural information than the moving-average break alone. This approach keeps the focus on price action.
A moving average can answer questions such as:
– Is recent price behaviour generally above or below its historical average?
– Is the calculated average rising, falling or flattening?
– How far has price moved from the average?
– Has price repeatedly interacted with the average?
– Is a moving average change occurring alongside a meaningful market structure change?
Cryptocurrency markets operate continuously, making multiple timeframe analysis particularly relevant. A moving average on a 5-minute chart describes a very different historical sample from a moving average on a daily chart. Traders should therefore always identify the timeframe before interpreting an indicator.
For instance, short-term price may fall below a moving average while the daily market structure remains intact. Conversely, a longer-term moving average shift may occur after a substantial change in the broader market. Comparing timeframes can help prevent traders from treating a short-term fluctuation as a major structural development.
Moving averages have several important limitations.
First, they lag because they are calculated from historical prices. Second, they can generate frequent changes in direction during sideways markets. Third, different periods can produce different interpretations of the same price data. Most importantly, a moving average cannot independently predict future cryptocurrency prices.
For proprietary trading firms, professional traders and individual investors alike, risk management remains separate from the indicator itself. Position sizing, liquidity, volatility, execution costs, leverage and the possibility of substantial or total loss will all need to be considered when trading digital assets.
Moving averages are valuable because they simplify historical price information and make changes in market structure easier to observe. Their greatest strength is also their defining limitation: they move as a consequence of past price action.
A rising moving average tells you that the historical prices included in its calculation have shifted upward. A falling average reflects the opposite. A crossover tells you that two sets of historical price observations have changed relative to one another.
Rather than treating moving averages as standalone prediction tools, traders can use them as a framework for studying trend direction, market structure, dynamic areas of interest and changes in historical momentum.
For anyone analysing cryptocurrency and digital asset markets, understanding what a moving average actually represents is more important than memorising a particular combination of periods. The indicator does not forecast the market—it organises information from the market’s past, allowing traders to evaluate that information alongside price structure, volatility and risk.
In conclusion, while the most recent price action on this Ethereum chart might, at the time of writing, look positive, the historical moving average indicators should always be used with caution and solely as an indicator that shows historical price action, not as an indicator to predict future movement.
The target(s) and/or pattern(s) on this chart is only theory and not a trade signal of any kind. Always do your own research before trading.
Past performance isn’t an indicator of future performance.