Published 6 April 2020
I am not one to ignore extremes. I have never been interested in the “number of touches”. This mindset has helped me with creating slightly more conservative plays that bear less risk and I often question the motives of those who draw trendlines and channels while adjusting them to suit their analyses (in a sense, to make them more “right”).
I have had a few ask for my opinion on BTC’s direction and in this idea, I would like to go into a little more detail on my rationale for the charts I have posted to date for Papa Bear.
One of the most common long-term channels I have seen drawn for Bitcoin is this one below. I never understood why anybody would want to draw a “long-term” channel while ignoring the “long-term” aspect of it. And I am talking some big names here!
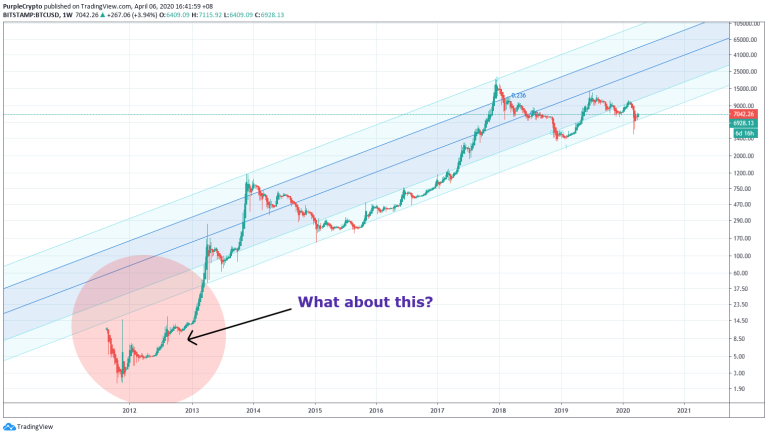
Some might say it was to suit their motives, which I am not going to speculate on.
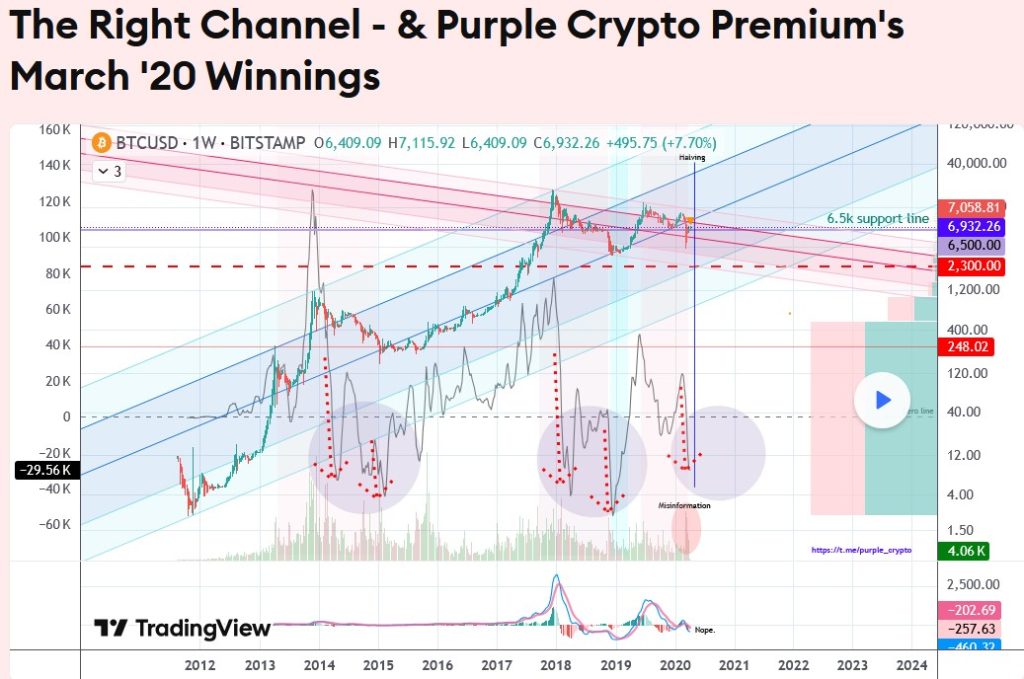
The recent increase we saw in volume just as price touched the lower end of the channel was a result of this misinformation. A lot of people bought in thinking it was “the bottom” as a result of that channel.
The following commentary is only applicable to those considering a long-term entry (don’t @ me if you trade anything under the daily).
On the main chart in this idea, I have marked out red/blue zones (in light colour in the background). Currently (and it has since last year), Papa Bear is sitting in the red zone, i.e. the “no buy zone” on this weekly chart. At the bottom of the chart, the squiggly black line is my indicator for “accumulation”. For me, accumulation only occurs below the zero line corresponding to this indicator. As you can see, contrary to what many have said, Papa Bear has NOT been in the accummulation zone (pretty little purple balls).
Often times, the market gets wiped out TWICE (red arrows) while in accummulation. The following opinion is based on this accummulation phase and from wave analysis.
Papa Bear still has a long road to recovery before I would contemplate playing for the long-term. It has only just entered the accummulation zone (pretty little purple ball) and, sadly, many more people who have been “longing” (thanks to being misinformed that “the bottom is in”) will be losing their hard-earned savings. This is why I have only used Papa Bear’s movements to set up plays with other cryptos that have more to offer in terms of short-term winnings.
Back to the channel story – my long-term channel is marked in blue. It takes into account ALL extremes of movement. I have marked a second medium-term ‘downtrend’ channel in red. This is the channel that interests me the most right now, especially where the two channels intersect.
In my previous analysis, I mention Papa Bear needing to accummulate below the 6.5k support line. I do expect it to downtrend further, as far as the horizontal red line marked on the chart. This is not to say it is going to go straight down to that point because that would be equally as stupid as saying it would go straight “to the moon”.
Of course, it’s going to have its ups and downs along the way. However, at Purple Crypto Premium, I am only concerned with this noise so far as to set up corresponding winning plays while it is in transit
Update 3 July 2025
An update to BTC’s trajectory over the past few years.
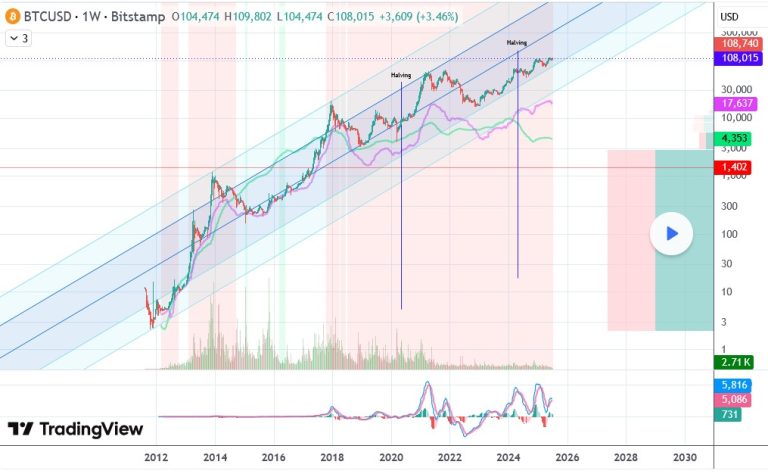
This chart demonstrates that BTC’s price action has been steadily following the mid 50% of my “right” channel (see idea linked below to understand what I mean by “right channel”). The last time BTC’s price broke out of the mid 50% range was back in December 2017’s high.
The most up to date volume profile indicates that the majority of the trading volume was pre-2017. The MACD indicator is a great example of BTC’s highly volatillity since the Dec 2017 high.
If BTC’s price breaks into the bottom 25% of the channel, I would expect a touch of the lower end of this channel. If the price bounces off the lower end of the mid 50% of this channel, we can expect higher highs in the not too distant future.
Update 13 May 2025
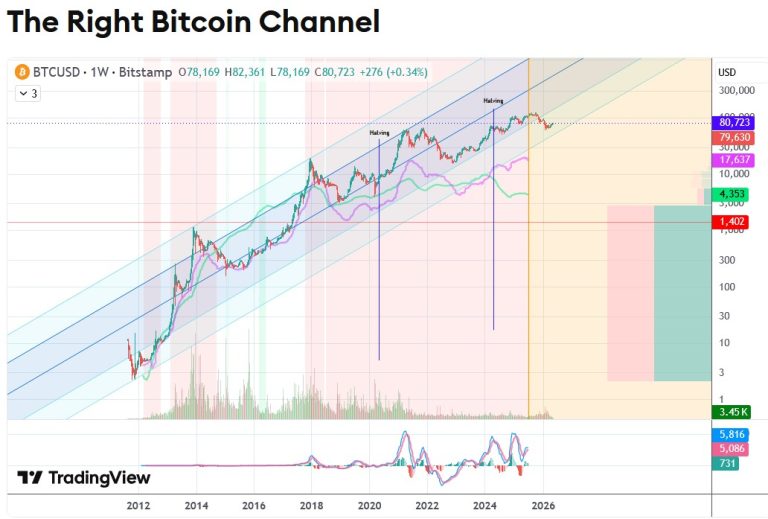
Almost a year since our last update and BTC is slowly edging towards the bottom of our uptrend channel (orange section are new weekly candles since the original post).
The target(s) and/or pattern(s) on this chart is only theory and not a trade signal of any kind. Always do your own research before trading.
Past performance isn’t an indicator of future performance.