Published 18 August 2019
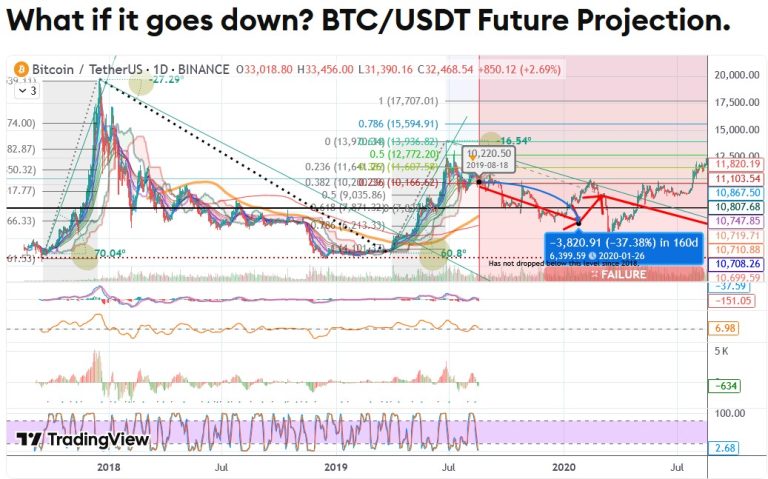
Chart published on Trading View.
rinted on August 18, this privately published chart is an idea for where BTC could head if at the end of the current corrective wave formation it downtrends.
Trend angles taken from the 2017 rise and projected forward to this rise could indicate a near term downtrend. As you would see from my other analyses, I would not dare utilise such angles from any trends other than the one prior, as trends can change over time.
Retracing the 2017 high to the fibb .618 level (a previous support turned resistance), this is still under the current support levels at the ~9400 mark. I am of the believe that if this level is broken, the downtrend is imminent. And if it isn’t broken, a new analysis for an uptrend will be required.
This year’s .618 fibb level is at around the 7750 mark.
The lowest point reached in 2018 after the downtrend was around the 3300 mark.
It is possible that we could be at the end of the 2018 uptrend and a possible downtrend could ensue at the end of the corrective wave formation. This chart provides an APPROXIMATION of what levels BTC could head to into the next year should this happen (all durations and magnitudes are a guide only – I am not a fortune teller 🙂 ).
The decline noted on the chart (from March ’20) will only occur if this downtrend is subwave 1 of a larger corrective wave. Whether it considers this retracement sufficient enough to follow with a whole new wave up or whether it proceeds further down (red arrow) will wholly depend on the market and the crypto Gods that be.
Update 29 September 2019
Did I say 7750? 🙂
Pretty accurate so far wouldn’t you agree?
Update 8 October 2019
Bang on the .618 fibb for support at present.
Update 2 January 2020
Almost there. The suspense is killing me! 🙂
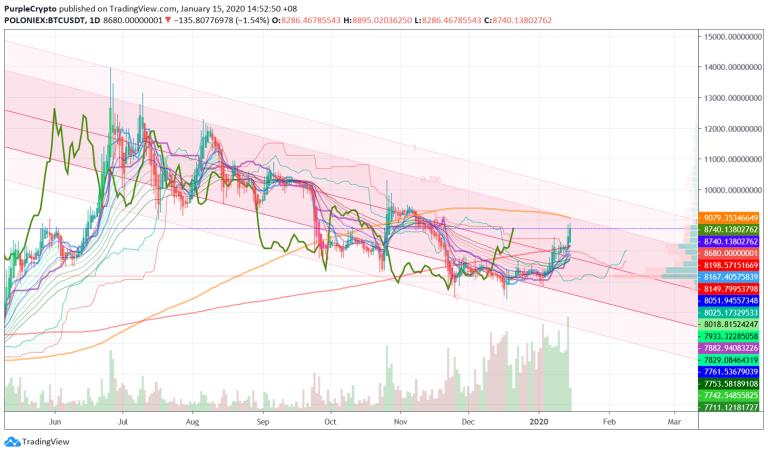
Update 15 January 2020
Not sure why people are screaming about it having cleared the channel. It hasn’t. It’s obvious where it’s heading though.
The target(s) and/or pattern(s) on this chart is only theory and not a trade signal of any kind. Always do your own research before trading.
Past performance isn’t an indicator of future performance.