
Published 8 July 2025
Updated September 2026
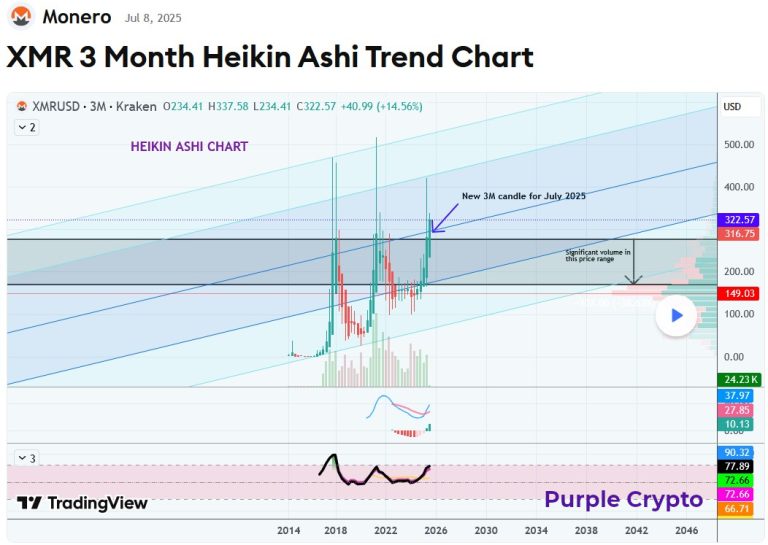
We have here a trend outlook chart for Monero on a 3 monthly timeframe (Heikin Ashi candlestick chart). XMR is one of a handful of high market cap coins which have showed signs of strength on a variety of indicators (despite high volatility with various other high market cap coins), including the positive MACD and RSI indicators as shown in this chart.
In addition, there has been significant buy volume in the 170 – 277 price range, as can be seen in the Price-Volume indicator to the right of the chart, keeping the price up.
Monero has withstood the political and economic turmoil in recent months making it a strong contender against some of the largest market cap coins. With the current price sitting at approximately USD$315, there is potential for further upside in the long-term.
January 2026 Update
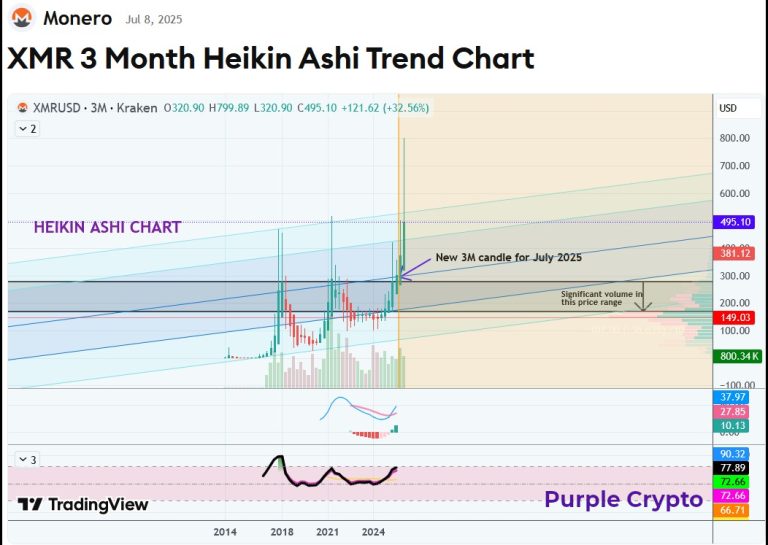
New all time high (ATH) of 800 reached.
September 2026 Update
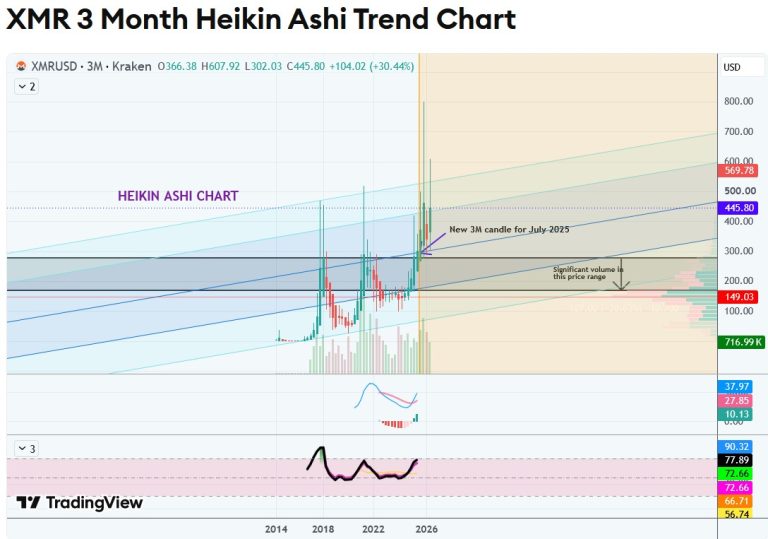
According to our comments below and as can be seen in the orange section of this chart, Monero reached an ATH shortly after publication of this idea.
Further to this, the new ATH also broke above and out of our long-term uptrend channel (in blue).
Following this, it has re-tested the “significant volume” price range marked on the chart, while breaking up and above the uptrend channel once again on the most recent Heikin Ashi candle.
It has now moved from favouring the bottom half of the uptrend channel to price action being mainly in the top half of the channel since publication of this idea last year.
As published on Trading View.
Past performance isn’t an indicator of future performance.