Published 29 May 2020
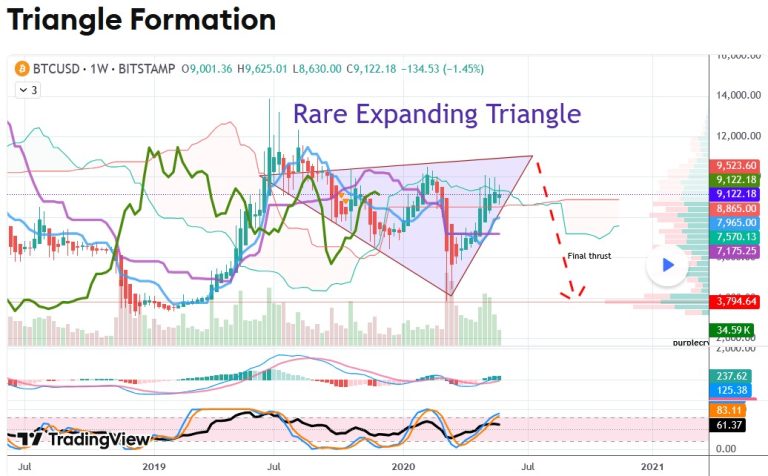
Chart published on Trading View.
Bitcoin seems to be exhibiting the formation of a rare Expanding Triangle, certain indicators
reveal.
Fibonacci retracement and extension values coincide perfectly with this formation as does
analysis of our Bitcoin ‘story’.
Should it continue in this formation, it presents an opportunity for a further uptrend in the short-
term. And if it matches the expectations of an expanding triangle, there is a possibility it will
follow with a final thrust down at a minimum to the point of control marked on the chart,
breaking the Ichinoku Senkou span B support line for the second time.
Such an outcome would coincide with our analysis of Bitcoin’s right channel.
While we haven’t played BTC this round, should Papa Bear decide to rise further, our existing
setups should fare well.
Update 27 June 2020
Chart update.
Based on Elliott wave analysis, Bitcoin may head upwards (potentially up to 10500 –
marked on the chart – or higher) before heading down.
Update 21 July 2020
Bitcoin’s rare expanding triangle has been updated with a new target to accommodate the
extended sideways price action.
Update 28 July 2020
Our $BTC target hit and beyond.
The target(s) and/or pattern(s) on this chart is only theory and not a trade signal of any kind. Always do your own research before trading.
Past performance isn’t an indicator of future performance.