Published 5 November 2019
At Purple Crypto Premium, we have had another ripper month of winning trades making us a total of 126.1% in winnings over four trades.
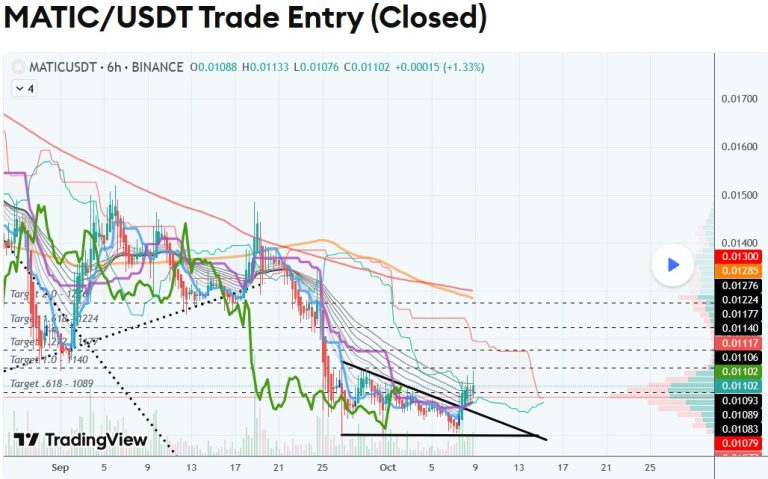
Chart published on Trading View.
MATIC had broken out and up of a bearish descending triangle – a very bullish move.
This along with other indicators made it a strong buy. This sat in well with my analysis of the probable start of the A-B wave of its medium-term correction.
Our final target was hit in under 8 hours, making us 15% in winnings.
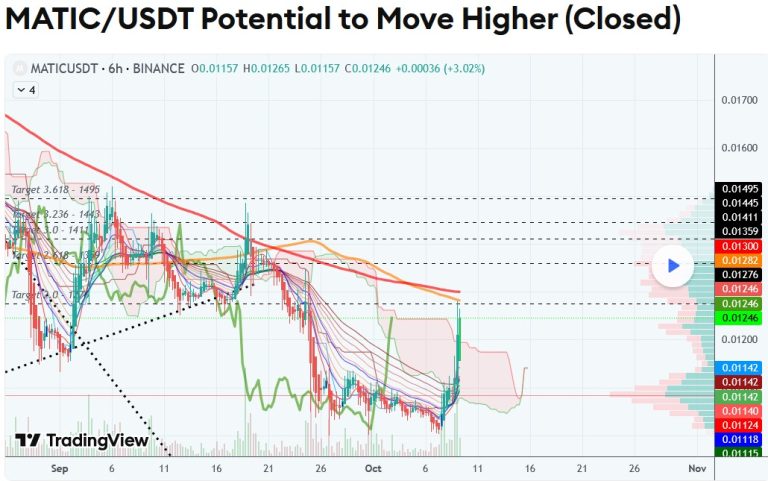
Chart published on Trading View.
Wave analysis of MATIC’s movements indicated it had the potential to move higher. It’s RSI had been decreasing on lower timeframes without much movement downwards in price. RSI on higher timeframes indicated potential for further movement up. This second MATIC setup made us 29% in winnings in under 24 hours.
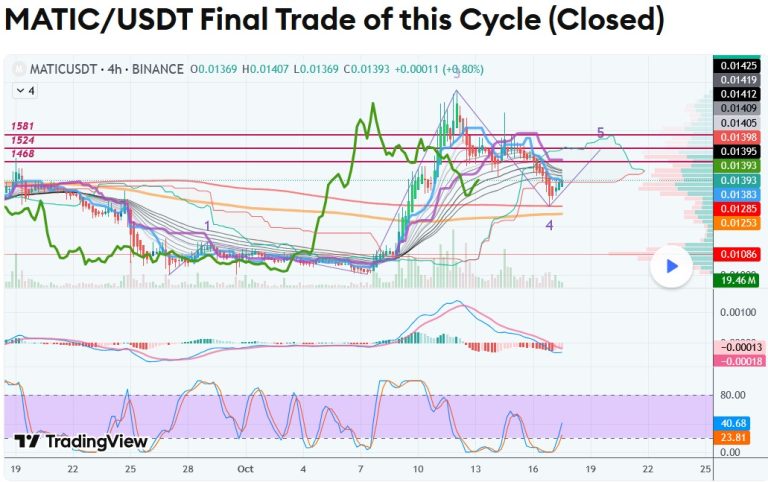
Chart published on Trading View.
Our third and final play with Matic this month – MATIC/USDT had begun its 5th subwave of this cycle and was ready for an entry. This play was closed at the reach of a stop loss point with 7.5% in winnings in total.
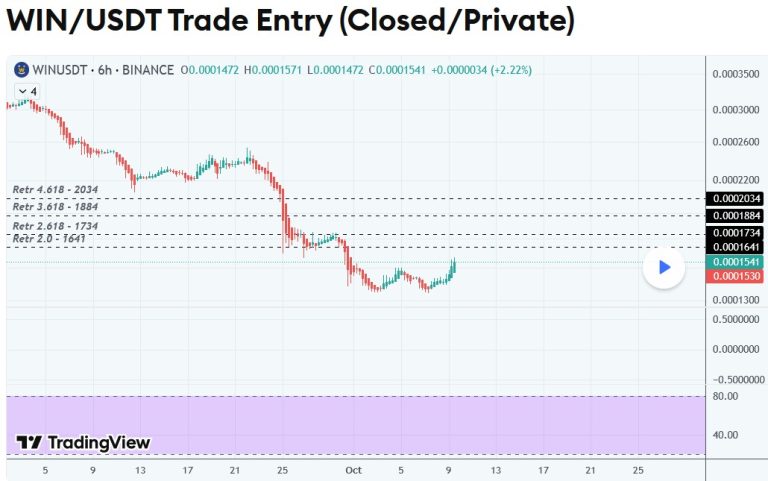
Chart published on Trading View.
Our fourth and final trade was for WIN/USDT generating a whopping 74.35% with double trade winning points, all posted in our Premium Telegram group at the time. It was almost scary. ::))
Commentary: Published 12 March 2020
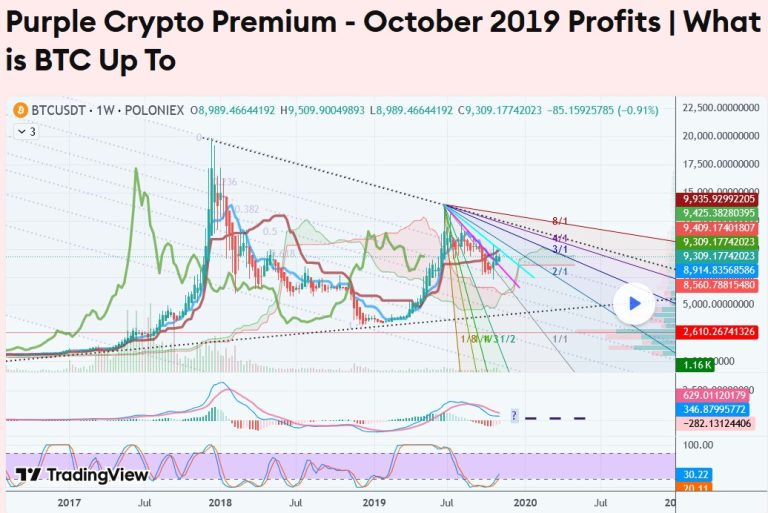
Papa Bear’s parabolic rise from 17-24 June 2019 was completely unexpected. Or was it?
My opinion has always been one of a bear run ever since I published “Papa Bear Set to End Its Bull Run” on August 10. Whether the most recent bull run (in early 2019) was indicative of the completion of sub-wave 5 of a grand super cycle or the completion of the A-B portion of the corrective cycle (according to some but not me) is open to a highly debatable discussion, the answer to which we can only know when this correction comes to an end.
What we do know is that it is still keeping within the 1-1 Gann trajectory. It has opened the week just above the pink trend-line I have had on previous charts creating a new blue trend-line. This will be an interesting week as I await its final destination.
Could it be sub-wave 1 of a larger trend? Where it eventually ends up is anybody’s guess but based on some clever thinking, the idea I published on August 18 indicating Papa Bear’s Future Projection has been playing out nicely so far. Time will tell how much BTC would like to stick to this game plan. It could well be taking off on its journey to becoming a seahorse! 🙂
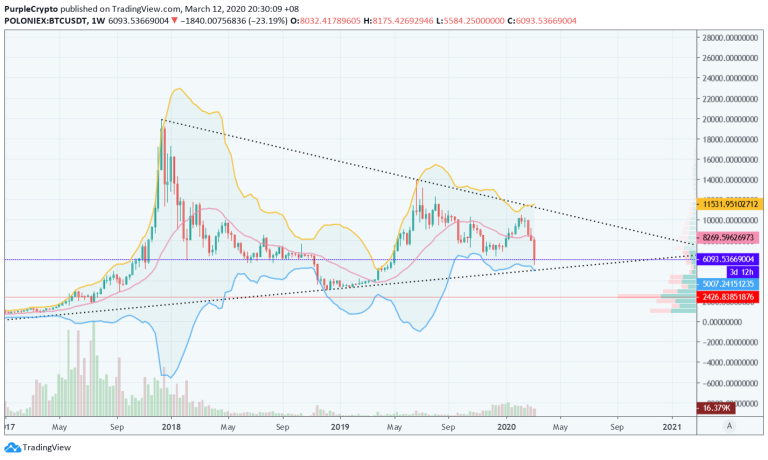
Update 12 March 2020
Parabolic up = parabolic down.
What happens when it mees its fate at the end of this symmetrical triangle is anybody’s guess. My eyes will be peeled on the point of control in this timeframe (not impossible).
The target(s) and/or pattern(s) on this chart is only theory and not a trade signal of any kind. Always do your own research before trading.
Past performance isn’t an indicator of future performance.