Published 27 August 2019
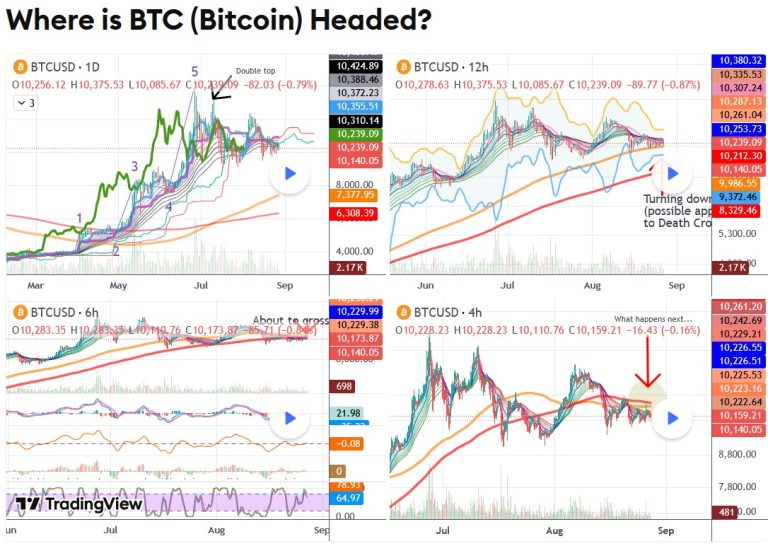
Chart published on Trading View.
I would like to share with you a comprehensive analysis of where is Bitcoin headed. An explanation of why there is so much confusion, why nothing seems positive and where we could possibly be headed. This is something I have shared with Purple Crypto Premium members.
I have here for you 4 charts drilling down from 1D to the 4H chart. It is clear we are in a corrective wave formation and have been for a while now. The 200 EMA has been nearing the 314 EMA on the 6H chart. It has crossed over on the 4H chart, and it looks like it is starting to turn down on the 12H chart. Point to note though is that on the 4H chart, it does look like it is starting to cross back over. What the?
Why the confusion? Because we are at the deciding point about the future of BTC. We are smack bang in the middle of a flat wave formation (which you can see clearly on the 6H chart) after hitting a double top (visible on the 1D) chart. So are we going up or down? Lol…
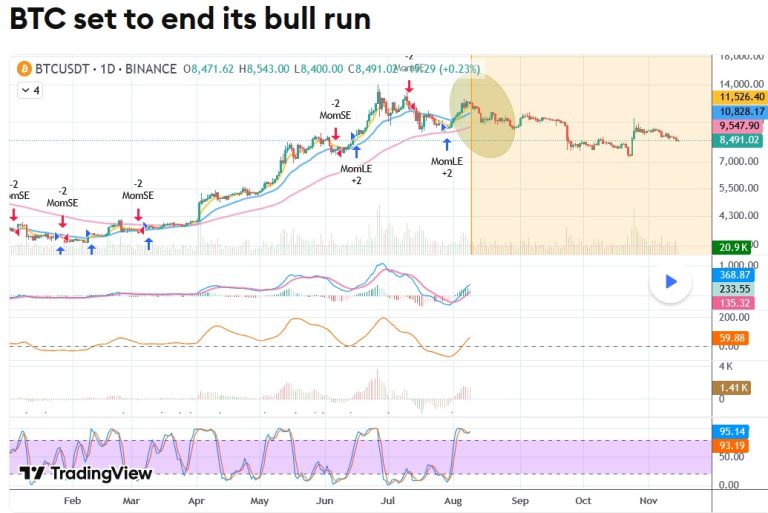
Here is my ‘BTC ends its bull run‘ analysis from August 10:
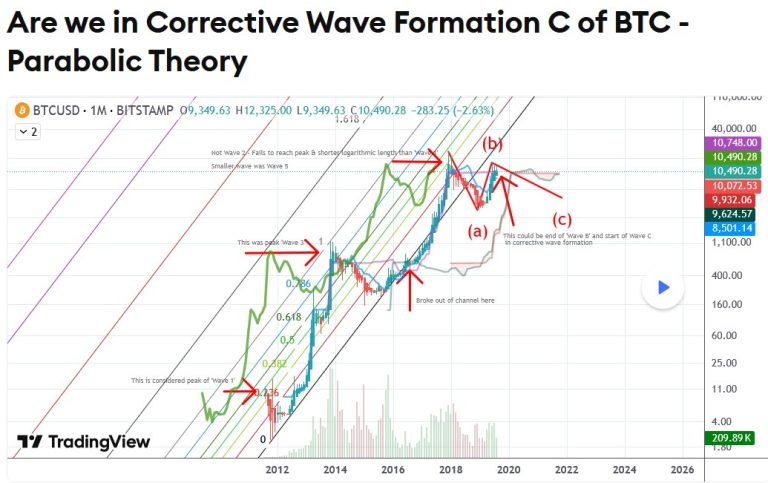
I have read several analyses of BTC’s “Parabolic Growth” theory (which btw, I think is absolutely rubbish). Here’s my take on it:
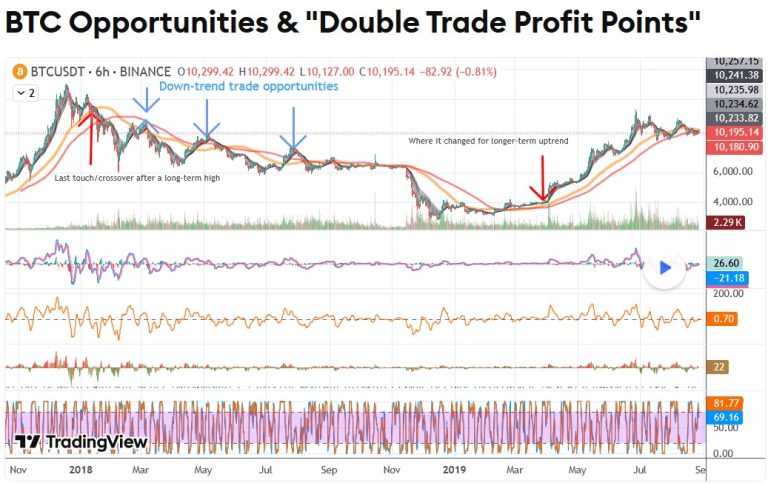
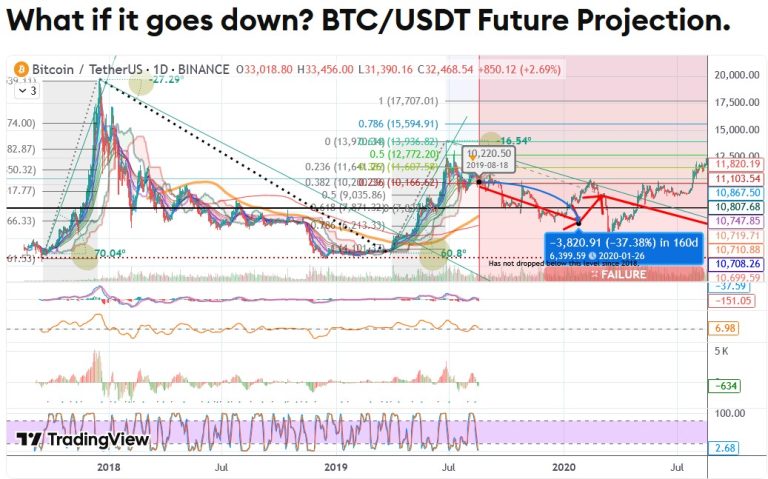
Do I want BTC to downtrend – NO. Who does? Oh yes…the whales. Do we have to prepared for it. YES. What do we do if BTC downtrends? Use what I refer to as “double trade profit points” to benefit from it (I absolutely love these). There is a hidden message in this chart…read carefully:
And here is a scenario for where BTC could be headed should it turn into a significant downtrend: What if it Goes Down – BTC/USDT Future Projection.
I would love for it to turn up as I am sure many of us would. However, right at this moment, anyone be crazy to make a prediction. There is simply no way to know and it is simply a matter of wait and see what happens.
Update 30 August 2019
I would like to highlight that the death cross has occurred on the 6H chart as of the 29th of August.
Update 12 September 2019
I should mention that the MAs on the 4H chart have done the death cross (again and as expected) and the 6H chart is nearing its one
Update 20 September 2019
The longer it tries to hold the trend line, the worst the crash will be. This is just the start.
BTC has just done the death cross on the 9H chart.
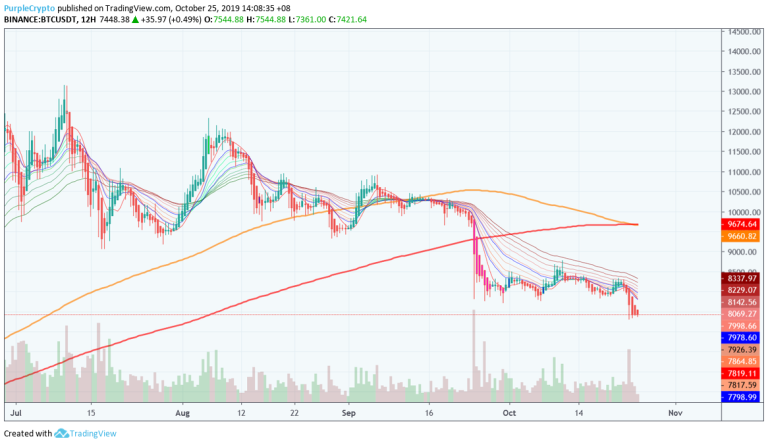
Update 25 August 2019
The death cross of the moving averages on the 12 hourly.
The target(s) and/or pattern(s) on this chart is only theory and not a trade signal of any kind. Always do your own research before trading.
Past performance isn’t an indicator of future performance.